

- Get to Know
Capcom - Management
Strategy - Business Activity
Achievements - ESG-based Value
Creation - Financial Data
Financial Highlight
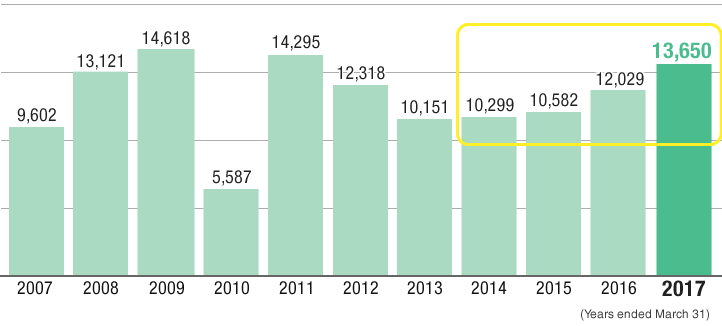
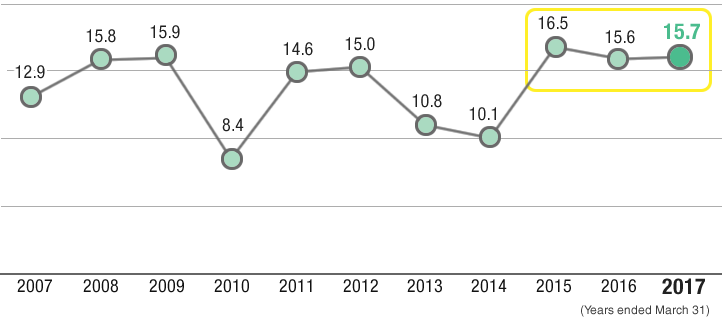
In line with structural reforms conducted in the fiscal year ended March 2004, operating income increased steadily until the fiscal year ended March 2009. In the fiscal year ended March 2010, the postponed release of major titles and the failure of some titles to meet sales targets overseas resulted in a temporary decline in income. In the fiscal year ended March 2011, we promoted profit structure reforms aimed at more efficient development investment. We promoted business restructuring by transitioning to in-house production and strengthened our digital download strategy in response to rapid changes in the market beginning in the fiscal year ended March 2013. As a result, operating income and operating margins underperformed until the fiscal year ended March 2014 while these reforms were implemented. However, since the fiscal year ended March 2014, operating income has increased for four consecutive fiscal years thanks to growth of the Consumer and Amusement Equipments businesses. Further, since the fiscal year ended March 2015, the operating margin has remained at approximately 16%.

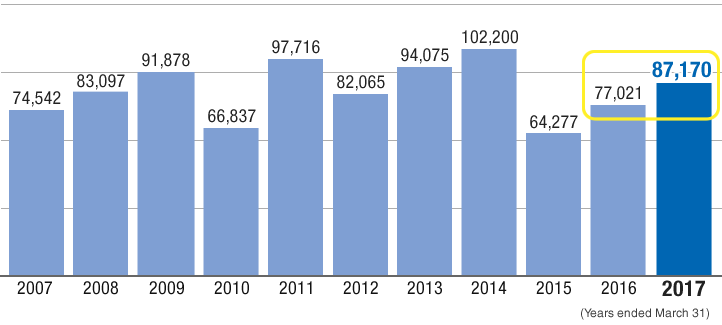
In the fiscal years ended March 2010 and March 2012, net sales declined due to the postponed release of titles. However, the promotion of structural reforms in the Consumer business resulted in Capcom achieving net sales of 100 billion yen in the fiscal year ended March 2014 for the first time. Although net sales decreased significantly in the fiscal year ended March 2015 due to a decline in pachislo machine releases, the steady release of major titles from the Consumer business since the fiscal year ended March 2016 has resulted in an increase in net sales for two consecutive fiscal years.

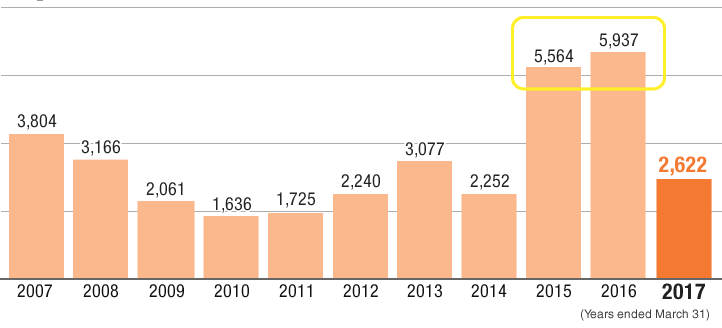
Capcom’s capital investment is mainly used to (1) purchase development equipment, (2) expand business offices in Japan and overseas and (3) open new amusement arcades. The main factor behind the increase in capital investment in the fiscal years ended March 2007, March 2008 and March 2013 was development environment improvements in line with the transition to next generation game consoles in the Consumer area. In the fiscal years ended March 2015 and March 2016, capital investments increased substantially in line with an increase in development employees required to expand our title lineup and the construction of two new development buildings.
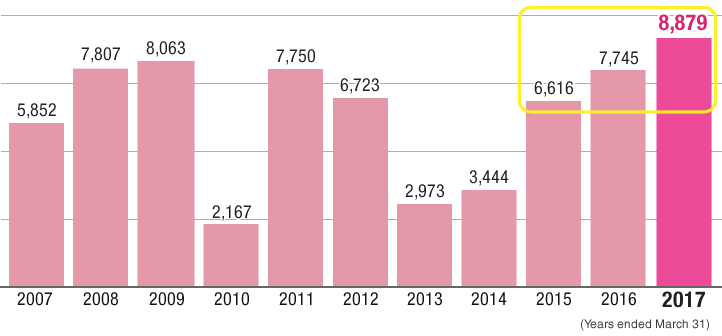
Performance was sluggish in the fiscal years ended in March 2010, 2013 and 2014, as (1) a complete overhaul to the Amusement Equipments’ underperforming profit structure, (2) development structure revisions in line with enhanced digital downloads in the Consumer business and (3) strengthened Mobile Contents business management capabilities in line with development organization integration resulted in the recognition of special losses on restructuring and business restructuring expenses. From the fiscal year ended March 2015, income increased four years in a row due to the benefits realized from development organization reforms.
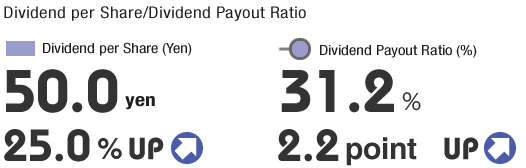
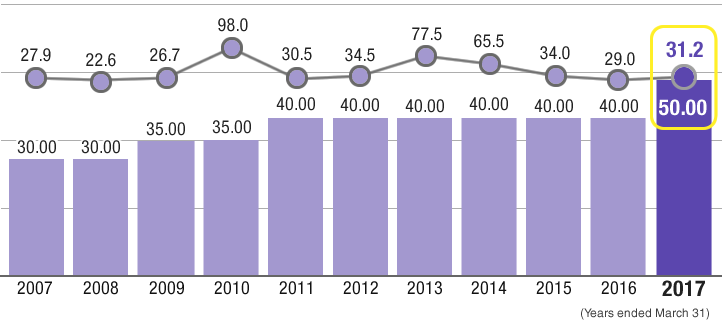
In the fiscal year ended March 2007, the annual dividend was raised to 30 yen thanks to the stable revenue base brought about by structural reforms. Moreover, from the fiscal year ended March 2009, the annual dividend was increased to 35 yen, and again up to 40 yen beginning in the fiscal year ended March 2011. In the fiscal year ended March 2017, it was raised again to 50 yen to clearly show shareholders that our basic shareholder return policy is to maintain a consolidated payout ratio of 30%.
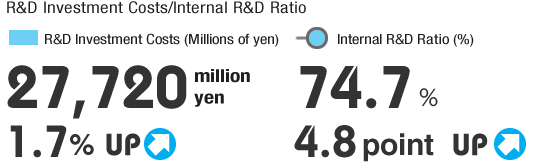
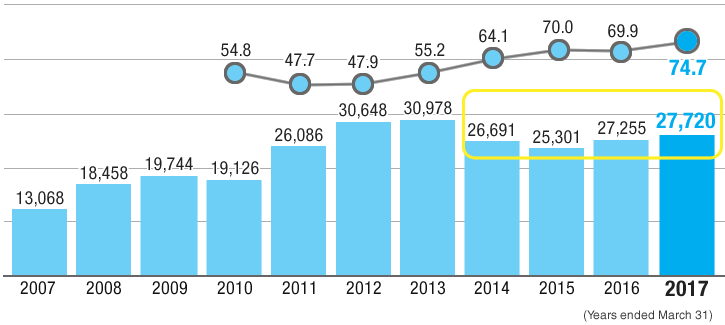
At Capcom, we believe the generation of creative and original content is the source of corporate growth, thus 80% or more of our annual development investments are allocated to the Digital Contents business. Recently in the Consumer segment, development costs have been trending higher in line with increasingly high-performance hardware, but we have been able to streamline development through increased employee utilization rates. Due to expanding our lineup, costs have increased significantly since the fiscal year ended March 2008; however, we expect them to remain around 30 billion yen going forward.

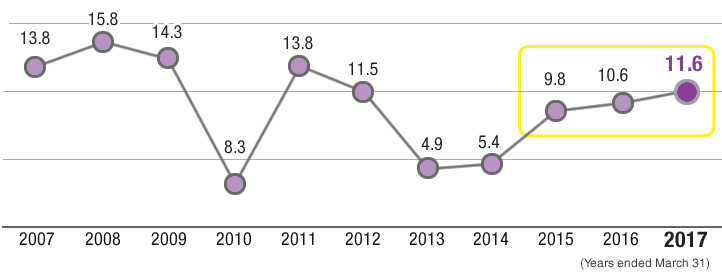
Although net assets increased between the fiscal years ended March 2007 and March 2009, stable net income resulted in ROE of around 14%. In the fiscal years ended in March 2010, 2013 and 2014, this figure declined due to decreases in net income from the recognition of special losses on restructuring and business restructuring expenses. From the fiscal year ended March 2015, ROE has once again been on the rise on the elimination of special losses and improved profitability.
PDF download
-
Get to Know Capcom (PDF: 4.3MB/17 pages)


