

- Get to Know
Capcom - Management
Strategy - Business Activity
Achievements - ESG-based Value
Creation - Financial Data
Financial Strategy According to the CFO
Financial Strategy According to the CFO
Proactively Investing in
a Stable Financial Foundation to Create a Virtuous Cycle of Growth

- What is the basic policy underpinning Capcom’s financial strategy?
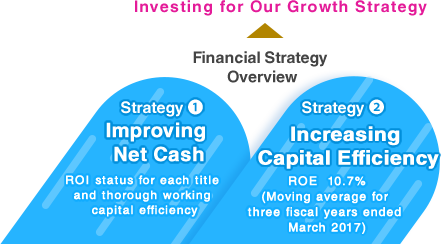
- We support the achievement of our growth strategies from a funding perspective.
Capcom has made an effort to improve net cash and increase capital efficiency to build a lean financial foundation and secure funding to invest in growth.
At present, we are executing a growth strategy aimed at enhancing corporate value over the medium- to long-term. We are increasing investment in R&D by approximately 30 billion yen every fiscal year to enhance the development environment in our core Digital Contents business and to bolster our title lineup.
We will more closely scrutinize the selection and concentration of invested capital and thoroughly review cost of sales, selling, general and administrative expenses and other costs and strive to improve our earnings structure. We will support the achievement of growth strategies from a funding perspective by strengthening our financial base, and securing cash and commitment lines at a level commensurate with the scale of investment.
- In what ways have you increased capital efficiency up to now?
- We exceeded our target for ROE.
We established a numerical target for ROE as an indicator of capital efficiency and achieved the following results.
| Target: (Moving average for three fiscal years ended March 2017) | 8-10% |
| Result: (Moving average for three fiscal years ended March 2017) | 10.7% |
We achieved the target with an ROE averaging 10.7% over the past three fiscal years.
In terms of priority items underlying the achievement of this target, (1) with regard to net income margin improvement, we were able to achieve stable increases compared with the previous three fiscal years. In addition, (2) TAT and (3) financial leverage are also on the rise.
| ROE components | 3/’15 | 3/’16 | 3/’17 | 3/’18 (Plan) |
|---|---|---|---|---|
| (1) Net margin (%) | 10.3 | 10.1 | 10.2 | 10.2 |
| (2) TAT (%) | 63.8 | 68.1 | 73.3 | – |
| (3) Financial leverage (times) | 1.41 | 1.50 | 1.53 | – |
| ROE(%) | 9.8 | 10.6 | 11.6 | 12.2 |
We forecast ROE of 12.2% in the next fiscal year.
We will perform composite checks comparing ROE to net sales, to the forecast, as well as year-over-year in order to continue improving these three factors.
- How will you secure net cash and manage risks?
- We are working on building a mechanism to efficiently create net cash.
For Capcom to efficiently generate net cash, we formulated two new financial strategies focused on generating cash flows through process management.
The first is to thoroughly manage return on investment. Accordingly, we manage a database able to compare the ROI status of each title while ascertaining and analyzing the investment profitability of each project.
The second strategy is to maximize working capital efficiency. To this end, we are creating a framework to manage our investment turnover period and turnover ratio in a more visible manner.
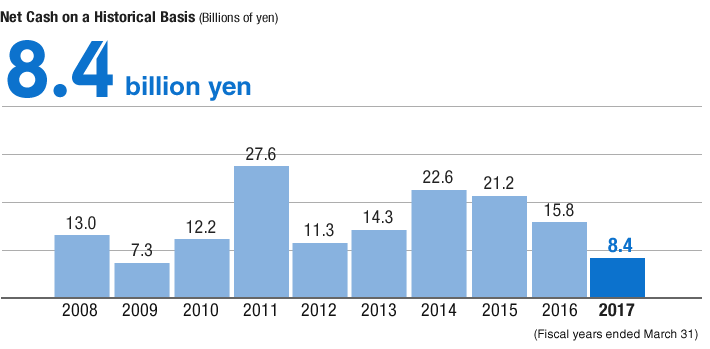
Moreover, net cash in the fiscal year under review was 8.4 billion yen, which decreased for the third year in a row. In addition to increased development investment in accordance with bolstering our lineup, this was mainly due to an approximately 10.0 billion yen increase in accounts receivable, trade, due to titles launched at the end of the fiscal year under review. Considering accounts receivable, trade, at the end of each fiscal year, the amount has generally been maintained at roughly the same level as net cash for the past several fiscal years.
Thus, we can say that assets contributing to so-called future growth, including the balance of titles in development, have been steadily rising.
- What is the status of internal reserves and fund procurement?
- We have secured levels enabling us to respond to normal increases in development costs.
Consumer game software development expenses have been on the rise since the arrival of high performance, multifunctional current-generation game consoles.
In addition to requiring a development period of two or more years for a major title, greater penetration of digital download sales is lengthening the lifecycle for games as well as the investment payback period.
Furthermore, even online games require ongoing investments for regular post-release updates and network infrastructure maintenance, thus we are required to keep a certain amount of cash on hand.
Given these conditions, to ensure our ability to procure funds, we determine the level of cash and cash equivalents that needs to be maintained in consideration of reserves from the investment plan and risk management. This amount will then be supplemented with cash on hand (24,337 million yen) as well as an unused 21.7 billion yen commitment line of credit (total contract value: 26.7 billion yen) to maintain an appropriate range.
- Specifically, what kind of growth strategy investments do you make?
- We invest 80% of management resources into the Digital Contents business.
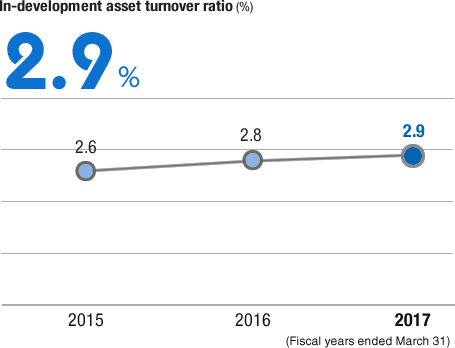
To achieve stable medium- to long-term growth, we recognize that it is critical to secure a sufficient amount of investment for the Digital Contents business, the source for our original IP. Specifically, in addition to an enhanced title lineup and new technologies including VR, we must invest in hiring more developers and improving our development environment. Accordingly, we will allocate about 80% of management resources (R&D investment and capital expenditure totaling 34.5 billion yen in the fiscal year ending March 31, 2018), amounting to an investment of 27.5 billion yen, in the Digital Contents business. Moreover, we use the asset in-development turnover rate as an indicator measuring investment level adequacy. In the fiscal year under review, the asset in-development turnover rate was 2.9, slightly higher than 2.8 in the previous fiscal year.
PDF download
-
Management Strategy (PDF: 2.62MB/22 pages)
Related Pages

[Business Activity Achievements]
Digital Contents
[Get to Know Capcom]
Financial Highlight


