IR Top Page > Financial Information > Segment Information
(as of May 8, 2020)
These tables and graphs show business and geographic segment information for the previous years.
Sales by Business Segment (historical data) (Excel: 37KB)
Operating Segments
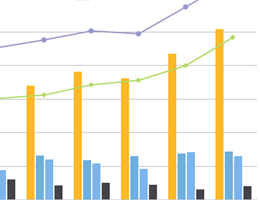
Sales by Business Segments in FY ended March 2020
5 Years Highlights
(Millions of yen)
2016/3 | 2017/3 | 2018/3 | 2019/3 | 2020/3 | |
---|---|---|---|---|---|
Digital Contents | 52,577 | 58,704 | 74,141 | 82,982 | 59,942 |
Arcade Operations | 9,056 | 9,525 | 10,231 | 11,050 | 12,096 |
Amusement Equipments | 13,343 | 16,856 | 7,803 | 3,422 | 6,533 |
Other Businesses | 2,043 | 2,083 | 2,338 | 2,575 | 3,018 |
Digital Contents
Arcade Operations
Amusement Equipments
Other Businesses
Regional Information
Sales by Region in FY ended March 2020
5 Years Highlights
(Millions of yen)
2016/3 | 2017/3 | 2018/3 | 2019/3 | 2020/3 | |
---|---|---|---|---|---|
Japan | 57,737 | 55,804 | 52,253 | 39,387 | 39,954 |
North America | 12,384 | 20,018 | 24,154 | 30,134 | 21,341 |
Europe | 5,221 | 9,007 | 12,035 | 19,387 | 10,667 |
Other | 1,681 | 2,340 | 6,072 | 11,121 | 9,628 |