- Value Creation
Story(PDF) - CEO
Commitment - Growth
Strategies - Financial Strategy
- Latest
Creative Report - Message from an External Director
Financial Strategy
According to the CFO
Kenkichi Nomura
Director, Executive Corporate Officer
and Chief Financial Officer (CFO)
A stable financial base for flexible investment and growth in an ever-changing market
- This marks the second consecutive year of achieving record profits, and the current cash balance is 53 billion yen. Has there been any change in your financial strategy?
- We will maintain our basic policy to improve net cash and increase capital efficiency supporting our growth strategy.
Capcom is executing a growth strategy aimed at enhancing corporate value over the medium-to-long term. We are conducting R&D investment on a scale of approximately 30 billion yen each fiscal year in our core Digital Contents business. As CFO, I am engaged in increasing capital efficiency and improving net cash to build a strong and flexible financial base to enable this investment, which accounts for approximately 30% of sales.
In the fiscal year ended March 31, 2019, investments in line with this growth strategy led to record-breaking unit sales in our Consumer sub-segment, as well as all-time high profits that increased net cash by 7.9 billion yen. Currently, our market environment is undergoing major changes, such as the spread of digital sales. Furthermore, we expect these changes to accelerate all the more over the next few years with the appearance of new technologies and services. In such an environment, our revenue structure has begun to change, increasing our investment options for strategic growth.
I will continue to concentrate on investment decisions that align with our growth strategy, while continuing to review the cost of sales, selling, general and administrative expenses and other costs to achieve an even leaner financial foundation. With our accumulated cash, we look to establish even greater profitability by increasing the value of our IPs to enable flexible investment in projects with high strategic priority, including the development of major titles and growth areas such as esports.
- How have you increased capital efficiency?
- We are making progress with our growth strategy and steadily improving ROE.
ROE, which we prioritize as an indicator of capital efficiency, is steadily improving along with performance growth. Of the three components of ROE, we place emphasis on the net income margin, which has seen further improvement following the progress of our growth strategy. Most recently, we have been focused on improving the balance between ROE and ROA, resulting in ROA improving to 10.1%.
| 3/2017 | 3/2018 | 3/2019 | 3/2020(Plan) | |
|---|---|---|---|---|
| ROE(%) | 11.6 | 13.4 | 14.4 | 14.9 |
| Net margin (%) | 10.2 | 11.6 | 12.5 | 16.5 |
| ROA(%) | 7.7 | 8.9 | 10.1 | – |
| Financial leverage (times) | 1.53 | 1.46 | 1.39 | – |
We expect ROE to rise to 14.9% next fiscal year. This year, we will continue to improve ROE and ROA by performing multi-faceted checks on the PL that compare performance against net sales, the plan and the previous fiscal year, and by paying close attention to BS management.
- How is Capcom creating net cash and managing risks?
- Beginning with managing ROI on a per title basis, we are working to improve productivity and visualize working capital efficiency.
Capcom employs two management methods to efficiently generate net cash. The first method is thorough management of returns on investment, where we carry out process management for investment return using a database that houses the ROI status of each title. If a title is progressing well, we continue investment as initially planned. However, if a problem is found, we engage measures for early detection and resolution of the specific issues.
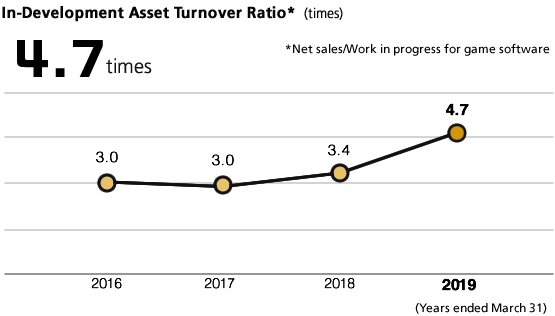
The second strategy is to maximize working capital efficiency. To this end, we are continuously monitoring our work-in-progress assets while creating a framework to manage our investment turnover period and turnover ratio in a more visible manner.
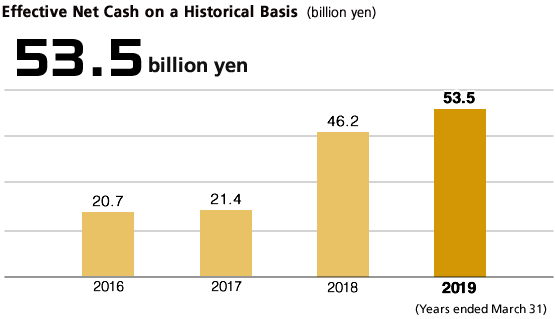
Net cash in the fiscal year under review was 44.6 billion yen, constituting a substantial increase. Further, "effective net cash," which was adjusted for accounts receivable and the balance of obligations at the end of the fiscal year accompanying major releases in the second half of the fiscal year—a unique feature of our industry—increased to 53.5 billion yen.
- What is the status of cash and fund procurement?
- We have secured levels enabling us to respond to the increasing scale of game development and longer sales periods.
Consumer game software development expenses have been on the rise since the current-generation of high performance, multifunctional game consoles arrived. Moreover, in addition to the fact that major titles take more than two years to develop, the penetration of digital sales has made long-term sales possible, and as a result, the payback period for investment funds is growing longer.
Given these conditions, we have positioned the commitment line as our method for procuring funds in case of changes to working capital, and in consideration of reserves for risk management and investment for primarily title development, we have set the level of cash and cash equivalents that must be maintained to be approximately one to two years’ worth of the amount we annually invest in development.
- Specifically, what kind of growth strategy investments do you make?
- We invest 87% of management resources in the core Digital Contents business.
To achieve stable medium- to long-term growth, we recognize that it is critical to secure a sufficient amount of investment for the Digital Contents business, the source for our original IP. Specifically, in addition to an enhanced title lineup and new technologies, we must invest in hiring more developers and improving our development environment. In the fiscal year ending March 31, 2020 we will allocate 29 billion yen, or 87% of total investments (R&D investment and capital expenditure totaling 33.5 billion yen), in the Digital Contents business. Moreover, we use the asset in-development turnover rate (net sales/work in progress for game software balance) as an indicator measuring investment level adequacy. In the fiscal year under review, the asset in-development turnover rate was 5.9 times, an increase compared to 3.7 times in the previous fiscal year.