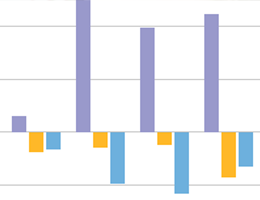
These tables and graphs present our ROE, ROA and other financial data for the previous years. In recent years, we have increased our investments aimed at sustaining growth. This is why R&D expenditures and capital expenditures have been climbing. Furthermore, we are taking actions aimed at improving our financial soundness. One way is by reducing debt. We are also operating more efficiently, such as by reducing assets to raise the ROA and the turnover ratio for total assets.
Financial Index
Financial Index (historical data) (Excel: 40KB)
Click on the articles to see the descriptions of the indexes.
2016/3 | 2017/3 | 2018/3 | 2019/3 | 2020/3 | |
---|---|---|---|---|---|
R&D investment costs (Millions of yen) | 27,255 | 27,720 | 29,077 | 27,038 | 25,843 |
Capital expenditures (Millions of yen) | 5,937 | 2,622 | 2,918 | 2,439 | 2,504 |
Depreciation and amortization (Millions of yen) | 5,712 | 5,980 | 4,706 | 3,228 | 2,795 |
Interest-bearing debt (Millions of yen) | 12,608 | 16,111 | 9,788 | 8,315 | 6,735 |
Return on equity (ROE)(%) | 10.6 | 11.6 | 13.4 | 14.4 | 16.9 |
Return on total assets (ROA)(%) | 7.2 | 7.7 | 8.9 | 10.1 | 12.0 |
Net worth ratio(%) | 66.5 | 65.4 | 68.4 | 71.9 | 69.5 |
Creditor's equity to total assets(%) | 33.5 | 34.6 | 31.6 | 28.1 | 30.5 |
Current ratio(%) | 339.6 | 285.0 | 354.0 | 391.2 | 303.5 |
Quick ratio (Acid-test ratio)(%) | 171.4 | 149.1 | 220.0 | 288.5 | 227.6 |
Cash equivalent ratio(%) | 127.2 | 81.8 | 172.1 | 228.3 | 183.1 |
Fixed ratio(%) | 49.4 | 43.0 | 35.0 | 36.7 | 34.7 |
Debt-equity ratio(%) | 50.4 | 52.9 | 47.0 | 39.1 | 43.8 |
Total assets turnover (times) | 0.7 | 0.7 | 0.8 | 0.8 | 0.6 |
Sales equity ratio (times) | 1.0 | 1.1 | 1.1 | 1.1 | 0.8 |
Receivables turnover (times) | 7.8 | 4.3 | 7.3 | 7.2 | 5.1 |
Accounts payable turnover (times) | 9.5 | 7.9 | 17.3 | 12.2 | 7.0 |
Inventory turnover (times) | 2.5 | 2.4 | 3.2 | 5.2 | 3.4 |
Fixed asset turnover ratio (times) | 2.1 | 2.6 | 3.2 | 3.1 | 2.4 |
Interest coverage ratio (times) | 36.5 | 22.8 | 337.2 | 249.3 | 302.5 |
Price-earnings ratio (times) | 19.9 | 13.5 | 23.0 | 21.5 | 20.3 |
R&D investment costs 
(Millions of yen)
![]() |
|
---|---|
Explanation | : Investments being expensed for research and development |
close
Capital expenditures 
(Millions of yen)
![]() |
|
---|---|
Explanation | : Investments being expenses for facilities and equipment |
close
Depreciation and amortization 
(Millions of yen)
![]() |
|
---|---|
Explanation | : Decrease in value of fixed assets calculated in a uniform method |
close
Interest-bearing debt 
(Millions of yen)
![]() |
|
---|---|
Explanation | : Liability-bearing interests |
Criteria | : ✓ Smaller, ✕ Bigger |
close
Return on equity (ROE) / Return on total assets (ROA) 
(%)
![]() |
|
---|---|
Explanation | : An index for return of equity |
Formula | : Net Income / (Net Assets - Minority interests - Hare Warronats) *100 |
Criteria | : ✓ Higher, ✕ Lower |
![]() |
|
---|---|
Explanation | : An index for return of asset |
Formula | : Net Income / Total Assets*100 |
Criteria | : ✓ Higher, ✕ Lower |
close
Net worth ratio / Creditor's equity to total assets 
(%)
![]() |
|
---|---|
Explanation | : Higher ratio indicates stability |
Formula | : Total Net Assets / Total Assets*100 |
Criteria | : ✓ Higher, ✕ Lower |
![]() |
|
---|---|
Explanation | : Lower ratio indicates stability |
Formula | : Total Liabilities / Total Assets*100 |
Criteria | : ✓ Higher, ✕ Lower |
close
Current ratio / Quick ratio (acid-test ratio) 
(%)
![]() |
|
---|---|
Explanation | : An index for payment capability against liabilities. Over 150% is desirable |
Formula | : Current Assets / Current Liabilities*100 |
Criteria | : ✓ Higher, ✕ Lower |
![]() |
|
---|---|
Explanation | : An index for short term solvency which is stricter than current ratio |
Formula | : Current Assets (except for Inventories) / Current Liabilities*100 |
Criteria | : ✓ 100% and over, ✕ Below 100% |
close
Cash equivalent ratio / Fixed ratio / Debt-equity ratio 
(%)
![]() |
|
---|---|
Explanation | : An index of payment capability only by cash and deposits in hand, stricter than quick ratio |
Formula | : Cash and Cash Equivalents / Current Liabilities*100 |
Criteria | : ✓ Higher, ✕ Lower |
![]() |
|
---|---|
Explanation | : An ratio of fixed assets over total assets |
Formula | : Fixed Assets / Total Net Assets*100 |
Criteria | : ✓ Lower, ✕ Higher |
![]() |
|
---|---|
Explanation | : An index for how much debt capital, which has obligation of restitution, is covered by stockholder's equity, which is out of obligation of restitution. |
Formula | : Total Liabilities / Stockholder's Equity(Net Assets - Minority Interests - Share Warrant) |
Criteria | : ✓ Higher, ✕ Lower (Sometime a company grows with usage of debt capital so that the comprehensive analysis is needed.) |
close
Total assets turnover / Sales equity ratio 
(times)
![]() |
|
---|---|
Explanation | : An index for assets usage rate, which indicates how many times the annual sales is against total assets. |
Formula | : Net Sales /{(Total Assets as of the end of previous FY+Total Assets as of the end of current FY)/ 2} |
Criteria | : ✓ Higher, ✕ Lower |
![]() |
|
---|---|
Explanation | : An index for capital usage rate, which indicates how many times the annual sales is against shareholders' equity. |
Formula | : Net Sales /{(Total Shareholders' Equity as of the end of previous FY+Total Shareholders' Equity as of the end of current FY)/ 2} |
Criteria | : ✓ Higher, ✕ Lower |
close
Receivables turnover / Accounts payable turnover 
(times)
![]() |
|
---|---|
Explanation | : An index for collection turnover of account receivables. Greater number shows swifter collection |
Formula | : Net Sales / {(Notes and accounts receivable - Advance receive at the end of previous period) + (Notes and accounts receivable - Advance receive at the end of current period)} / 2 |
Criteria | : ✓ Higher, ✕ Lower |
![]() |
|
---|---|
Explanation | : An index for payment turnover of account payables. Greater number shows quicker payment |
Formula | : Net Sales / {(Notes and accounts payable - Advance payment at the end of previous period) + (Notes and accounts payable - Advance payment at the end of current period)} / 2 |
Criteria | : ✓ Higher, ✕ Lower |
close
Inventory turnover / Fixed asset turnover ratio 
(times)
![]() |
|
---|---|
Explanation | : An index for inventory turnover. The number dwindles because of inventory increase and/or no-active inventory. |
Formula | :Net Sales / {(Inventories at the end of previous period + Inventories at the end of current period) / 2} |
Criteria | : ✓ Higher, ✕ Lower |
![]() |
|
---|---|
Explanation | : An ratio of fixed assets against net sales. An index of efficiency of fixed assests usage |
Formula | : Net Sales / {Fixed Assets at the end of previous period + Fixed Assets at the end of current period) / 2} |
Criteria | : ✓ Higher, ✕ Lower |
close
Interest coverage ratio 
(times)
![]() |
|
---|---|
Explanation | : An index for payment capability for interests |
Formula | : Operating Cash Flow / Interest |
Criteria | : ✓ Higher, ✕ Lower |
close