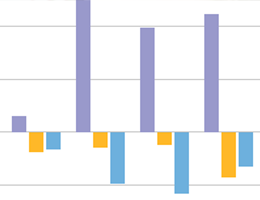
The tables and graphs on this page show our sales, operating income and other aspects of performance over the previous years. Despite the high volatility of the home video game industry, we have been growing sustainably.
Operating Results
Operating Results (historical data) (Excel: 37KB)
Click on the items to see the descriptions of the indexes.
2016/3 | 2017/3 | 2018/3 | 2019/3 | 2020/3 | |
---|---|---|---|---|---|
Net sales (Millions of yen) | 77,021 | 87,170 | 94,515 | 100,031 | 81,591 |
Operating income (Millions of yen) | 12,029 | 13,650 | 16,037 | 18,144 | 22,827 |
Operating margin (%) | 15.6 | 15.7 | 17.0 | 18.1 | 28.0 |
Net income per share (Millions of yen) | 7,745 | 8,879 | 10,937 | 12,551 | 15,949 |
Net income attributable to owners of the parent (yen) | 137.75 | 160.35 | 99.89 | 115.45 | 149.41 |
Annual cash dividends per share (yen) | 40.00 | 50.00 | 60.00 | 35.00 | 45.00 |
* With an effective date of April 1, 2018, Capcom performed a 2-for-1 stock split of its common stock.
Capcom calculated "Net income per share" for the year ended March 31, 2018 assuming that the stock split was implemented with an effective date of April 1, 2017.
* Effective from the beginning of the FY2018, Capcom has applied "Implementation Guidance on Tax Effect Accounting"
(ASBJ Guidance No. 28, February 16, 2018). The return (ordinary income) on assets for the FY2017 have undergone retrospective application.
Net sales
FY2019 Net sales |
81,591 million yen |
18.4% Down ![]() |
---|
Explanation | : Consolidated net sales being generated by businesses' operations |
---|---|
Criteria | : ✓ Bigger, × Smaller |
Operating income / Operating margin
FY2019 Operating income |
22,827 million yen |
25.8% UP ![]() |
---|
FY2019 Operating margin |
28.0% |
9.9 points UP ![]() |
---|
Explanation | : An index for profitability of businesses' operations alone |
---|---|
Formula | : Operating Profit / Net Sales*100 |
Criteria | : ✓ Higher, × Lower |
Net income attributable to owners of the parent
FY2019 Net income attributable to owners of the parent |
15,949 million yen |
27.1% UP ![]() |
---|
Explanation | :Consolidated net income including extraordinary profit and loss |
---|---|
Criteria | : ✓ Bigger, × Smaller |
Net income per share
FY2019 Consolidated net income per share |
149.41 yen |
33.96 yen UP ![]() |
---|
* With an effective date of April 1, 2018, Capcom performed a 2-for-1 stock split of its common stock.
Capcom calculated "Net income per share" for the year ended March 31, 2018 assuming that the stock split was implemented with an effective date of April 1, 2017.
Explanation | : An index for assessing investment value per share. The larger the figure, the more favorable. |
---|---|
Formula | : Net Income / (Number of Shares Issued - Treasury Stock) |
Dividend per share / Dividend payout ratio
FY2019 Dividend per share |
45.00 yen |
10.00 yen UP ![]() |
---|
FY2019 Dividend payout ratio |
30.1 % |
0.2 points Down ![]() |
---|
Note: A stock split took place as at April 1, 2018, whereby one ordinary share was split into two shares; the annual dividend per share for FY2018 would be ¥70 if it were calculated based on the number of shares before the stock split.
Explanation | : An annual dividend per share |
---|---|
Formula | : Dividend / (Number of Shares Issued - Treasury Stock) |
Criteria | :✓ Bigger, × Smaller |