

- Capcom’s Value Creation
- Medium- to Long-Term
Growth Strategy - The Heart of
Value Creation - ESG-Based
Value Creation - Financial Analysis
Financial Strategy According to the CFO

Director, Executive Corporate Officer
and Chief Financial Officer (CFO)
Kenkichi Nomura
Financial Strategy
Overview
Strategy 1
Improving Net Cash
Thoroughly track the Return on Investment (ROI) status for each title and streamline working capital

Strategy 2
Increasing Capital Efficiency
Stably Increase Return on Equity (ROE)

- Having achieved record profits, are there any changes to the financial strategy?
- We will maintain efforts to increase capital efficiency and improve net cash.
Capcom is executing a growth strategy aimed at enhancing corporate value over the medium-to-long term. We are conducting R&D investment amounting to approximately 30 billion yen each fiscal year, to enhance our development environment and strengthen the title lineup in our core Digital Contents business.
We have been engaged in increasing capital efficiency and improving net cash to build a strong and flexible financial base to make this investment possible.
In the fiscal year ended March 31, 2018, investments based on this growth strategy led to record-breaking major title hits, resulting in all-time high profits that increased cash on hand. In our industry, which continues to rapidly advance, the rise of numerous new technologies and services is also increasing our investment options.
That being said, I will maintain the standards we have established for investment decisions and strive for selection and concentration while engaging in a thorough review of the cost of sales, selling, general and administrative expenses and other costs to achieve an even leaner financial foundation. Moreover, we will stably secure a financial base at a level commensurate with the scale of investment to enable flexible investment in projects with high strategic priority, such as the development of major titles contributing to enhanced IP value, and growth areas including esports.
- How have you increased capital efficiency?
- We are making progress with our growth strategy and steadily improving ROE.
We focus on ROE as an indicator of capital efficiency, which is steadily increasing with performance growth. Of the three components of ROE, we place emphasis on (1) the net income margin, which has seen further improvement following the progress of our growth strategy. In addition, total assets and shareholders’ equity have remained at an appropriate level, with (2) Total Asset Turnover (TAT) and (3) financial leverage generally maintaining their upward trends.
| ROE components | 3/2016 | 3/2017 | 3/2018 | 3/2019 (Plan) |
|---|---|---|---|---|
| (1) Net margin (%) | 10.1 | 10.2 | 11.6 | 12.5 |
| (2) TAT (%) | 68.1 | 73.3 | 75.3 | – |
| (3) Financial leverage (times) | 1.50 | 1.53 | 1.47 | – |
| ROE (%) | 10.6 | 11.6 | 13.4 | 13.4 |
We forecast ROE of 13.4% in the next fiscal year. We will perform composite checks comparing ROE to net sales, to the forecast, as well as year-over-year in order to continue improving these three factors.
- How will Capcom secure net cash and manage risks?
- We will carefully manage ROI for each title and visualize working capital efficiency.
For Capcom to efficiently generate net cash, we formulated two financial strategies focused on generating cash flows through process management. The first is to thoroughly manage return on investment. Accordingly, we manage a database housing the ROI status of each title while ascertaining and analyzing investment profitability. The second strategy is to maximize working capital efficiency. To this end, we are creating a framework to manage our investment turnover period and turnover ratio in a more visible manner.
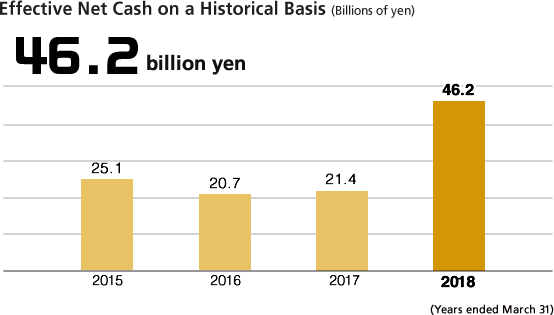
Moreover, net cash in the fiscal year under review was 36.7 billion yen, constituting a substantial increase. Further, "effective net cash," which was adjusted for accounts receivable and the balance of obligations at the end of the fiscal year accompanying the release of a major title in the second half of the fiscal year—a unique feature of our industry—increased to 46.2 billion yen. Although the balance of work in progress for game software declined due to the release of major titles at the end of the fiscal year and revisions to the valuation of some balances, overall assets that contribute to future growth continued to steadily increase.
- What is the status of internal reserves and fund procurement?
- We have secured levels enabling us to respond to the increasing scale of game development and longer investment recovery periods.
Consumer game software development expenses have been on the rise since the current-generation of high performance, multifunctional game consoles arrived.
In addition to requiring a development period of two or more years for a major title, greater penetration of digital download sales has enabled a longer lifecycle for games, resulting in a longer investment payback period. Furthermore, even online games require ongoing investments for regular post-release updates and network infrastructure maintenance, thus we are required to keep a certain amount of cash on hand.
Given these conditions, to simplify our ability to procure funds, and in consideration of reserves for the investment plan and risk management, we have set the level of cash and cash equivalents that must be maintained to be approximately one to two years’ worth of the amount we annually invest in development. This amount is supplemented with cash on hand (46,539 million yen) as well as an unused 26.7 billion yen commitment line of credit (total contract value: 26.7 billion yen) to maintain an appropriate range.
- Specifically, what kind of growth strategy investments do you make?
- We invest 84% of management resources in the core Digital Contents business.
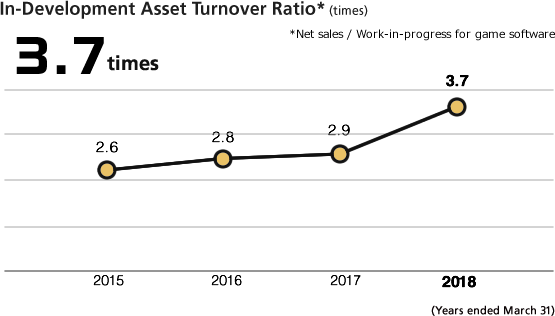
To achieve stable medium- to long-term growth, we recognize that it is critical to secure a sufficient amount of investment for the Digital Contents business, the source for our original IP. Specifically, in addition to an enhanced title lineup and new technologies, we must invest in hiring more developers and improving our development environment. Accordingly, we will allocate 84% of management resources (R&D investment and capital expenditure totaling 34.5 billion yen in the fiscal year ending March 31, 2019), amounting to an investment of 29.0 billion yen, in the Digital Contents business. Moreover, we use the asset in-development turnover rate as an indicator measuring investment level adequacy. In the fiscal year under review, the asset in- development turnover rate was 3.7 times, an increase compared to 2.9 times in the previous fiscal year.
PDF download
-
Medium- to Long-Term Growth Strategy (PDF:3.28MB/22 pages)
Related Pages

[Medium- to Long-Term Growth Strategy]
The COO’s Discussion of Growth Strategies
Capcom COO Haruhiro Tsujimoto discusses our growth strategies; "Consumer", "Mobile" and "Esports".

[Capcom’s Value Creation]
Financial Highlights


