Business Segments
-

Digital Contents
(FY2025)
-
% of Consolidated
Net Sales73.9%
-
Net Sales
144,277MJPY
(Up 15.3% YoY)
-
Operating
margin56.4%
This business develops and sells digital game content for consumer home video game and PC platforms. It also develops, manages, and licenses its IP out for Mobile Contents. Using our world-class development environment, we deliver high-quality content digitally to more than 220 countries and regions, resulting in long-term and continuous sales that underpin our robust profitability.
FY2025 Financial Results
-
Net Sales/Operating margin
 Net Sales (MJPY)
144,277  Operating margin (%)
56.4 (Years ended March 31)
-
Assets
Assets (MJPY)119,155 (Years ended March 31)
Topics in FY2025
-
Resident Evil Requiem

-
Devil May Cry 5 Special Edition

Business Segment Results and Plans-
Earnings Supplement (FY26/3 Results & FY27/3 Plan)
PDF
-
-

Arcade Operations
(FY2025)
-
% of Consolidated
Net Sales13.1%
-
Net Sales
25,656MJPY
Up 12.8% YoY
-
Operating
margin14.1%
We operate amusement facilities, primarily Plaza Capcom arcades, in Japan. We mainly open arcades in large commercial complexes, and in recent years have also expanded into new store formats such as cafés and merchandising. By holding events and other activities, we aim to maximize the appeal of our brick-and-mortar stores and create synergies with our other businesses.
FY2025 Financial Results
-
Net Sales/Operating margin
 Net Sales (MJPY)
25,656  Operating margin (%)
14.1 (Years ended March 31)
-
Assets
Assets (MJPY)13,879 (Years ended March 31)
Topics in FY2025
-
Capcom Store Taipei

Business Segment Results and Plans-
Earnings Supplement (FY26/3 Results & FY27/3 Plan)
PDF
Related Article -
-

Amusement Equipments
(FY2025)
-
% of Consolidated
Net Sales9.1%
-
Net Sales
17,780MJPY
Up 13.9% YoY
-
Operating
margin64.3%
This business utilizes the content from our home video games. We focus primarily on the development, manufacture and sales of software, frames and LCD devices for gaming machines.
FY2025 Financial Results
-
Net Sales/Operating margin
 Net Sales (MJPY)
17,780  Operating margin (%)
64.3 (Years ended March 31)
-
Assets
Assets (MJPY)12,283 (Years ended March 31)
Topics in FY2025
-
Smart Slot Shin Onimusha 3

Business Segment Results and Plans-
Earnings Supplement (FY26/3 Results & FY27/3 Plan)
PDF
Related Article -
-

Other Businesses
(FY2025)
-
% of Consolidated
Net Sales3.9%
-
Net Sales
7,650MJPY
(Up 25.2% YoY)
-
Operating
margin59.7%
Based on our Single Content Multiple Usage strategy of leveraging game IP across different media, we pursue a variety of licensing business opportunities. In addition to adapting game content into movies, animated television programs, music CDs, character merchandise and other products as part of our licensing business, we are also devoting resources to our esports business.
FY2025 Financial Results
-
Net Sales/Operating margin
 Net Sales (MJPY)
7,650  Operating margin (%)
59.7 (Years ended March 31)
-
Assets
Assets (MJPY)10,801 (Years ended March 31)
Topics in FY2025
-
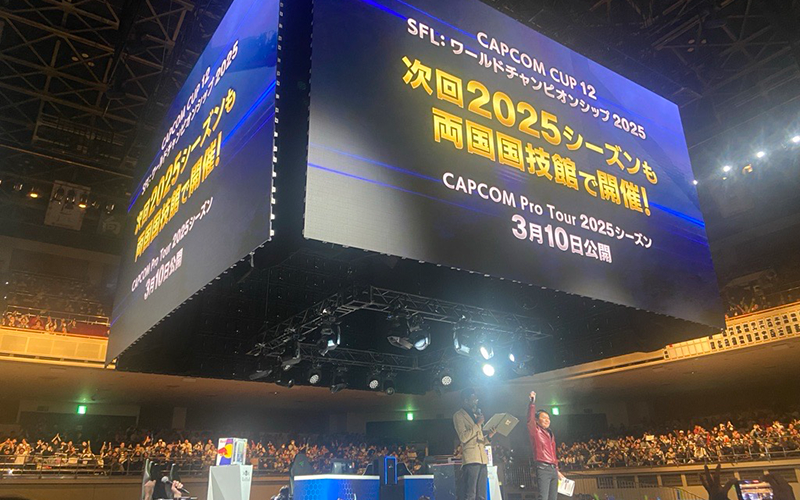
Esports Street Fighter League: Pro-JP 2025
Business Segment Results and Plans-
Earnings Supplement (FY26/3 Results & FY27/3 Plan)
PDF
Related Article -