

- Capcom’s Value Creation
- Medium- to Long-Term
Growth Strategy - The Heart of
Value Creation - ESG-Based
Value Creation - Financial Analysis
Financial and ESG HighlightsPresent
Financial Highlights
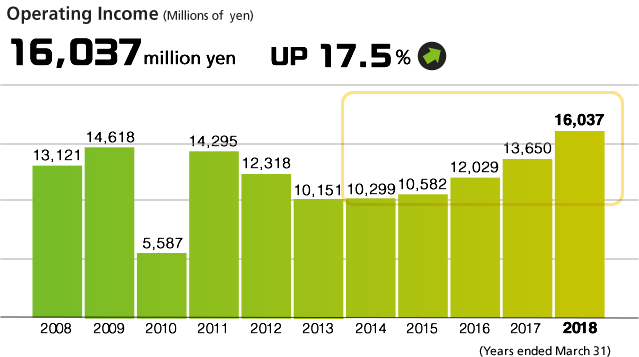
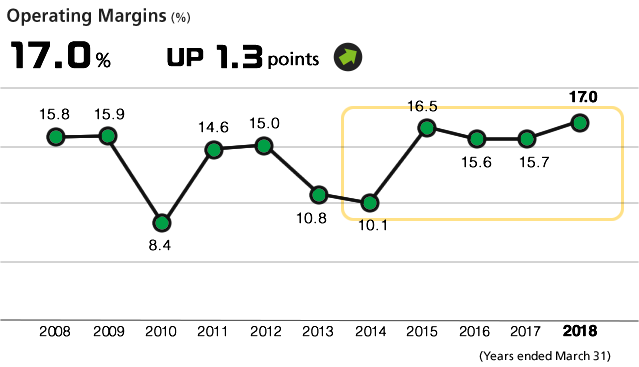
In line with structural reforms conducted in the fiscal year ended March 2004, operating income increased steadily until the fiscal year ended March 2009. In the fiscal year ended March 2010, the postponed release of major titles and the failure of some titles to meet sales targets overseas resulted in a temporary decline in income. In the fiscal year ended March 2011, we promoted profit structure reforms aimed at more efficient development investment. We promoted business restructuring by transitioning to in-house production and strengthened our digital download strategy in response to rapid changes in the market beginning in the fiscal year ended March 2013. As a result, operating income and operating margins underperformed until the fiscal year ended March 2014 while these reforms were implemented. However, since the fiscal year ended March 2014, operating income has increased for five consecutive fiscal years thanks to growth of the Consumer and Amusement Equipments businesses. Notably, in the fiscal year ended March 2018, the hit performance of Monster Hunter: World resulted in record income, and the operating margin also improved.
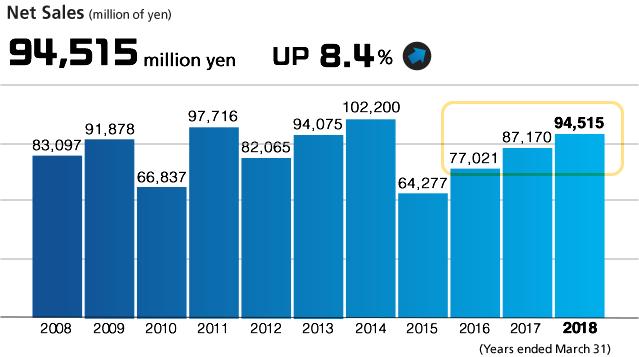
In the fiscal years ended March 2010 and March 2012, net sales declined due to the postponed release of titles. However, the promotion of structural reforms in the Consumer business resulted in Capcom achieving net sales of 100 billion yen in the fiscal year ended March 2014 for the first time.
Although net sales decreased significantly in the fiscal year ended March 2015 due to a delay in pachislo machine releases, the steady release of major titles from the Consumer business since the fiscal year ended March 2016 has resulted in an increase in net sales for three consecutive fiscal years.
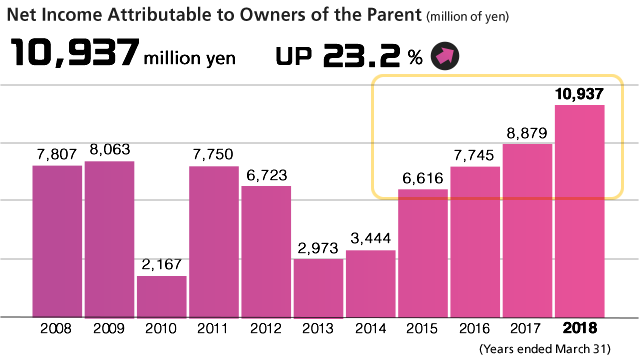
Performance was sluggish in the fiscal years ended in March 2010, 2013 and 2014, as (1) a complete overhaul to the Amusement Equipments’ underperforming profit structure, (2) development structure revisions in line with enhanced digital downloads in the Consumer business and (3) strengthened Mobile Contents business management capabilities in line with development organization integration resulted in the recognition of special losses on restructuring and business restructuring expenses. From the fiscal year ended March 2015, income increased five years in a row due to the benefits from development organization reforms beginning to manifest.
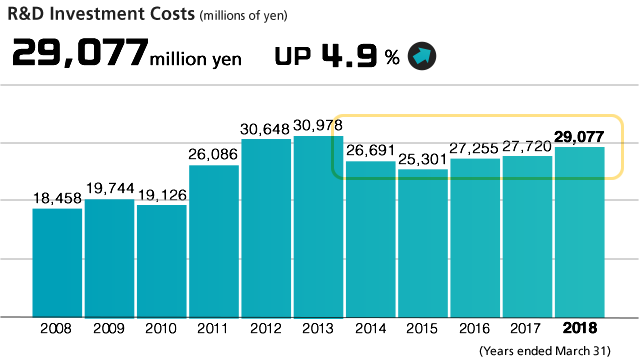
At Capcom, we believe the generation of creative and original content is the source of corporate growth, thus 90% or more of our annual development investments are allocated to the Digital Contents business. Recently in the Consumer segment, development costs have been trending higher in line with increasingly high-performance hardware, but we have been able to streamline development through increased employee utilization rates. Due to expanding our lineup, costs have been on the rise since the fiscal year ended March 2008; however, we expect them to remain around 30 billion yen going forward.
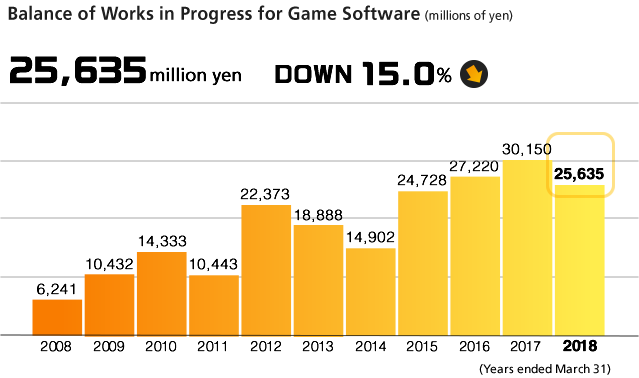
The balance of work in progress for game software has been on the rise in line with increasingly high-performance hardware. In the fiscal years ended March 2011 and 2014, it decreased with the release of major titles. Since the fiscal year ended March 2015, it has been increasing again with expansion of the lineup and release of new-generation hardware, but in the fiscal year ended March 2018 it decreased owing to the release of Monster Hunter: World and the reevaluation of some unprofitable titles.
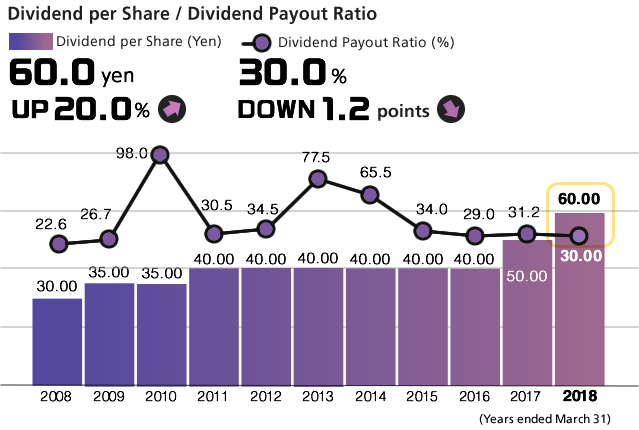
Up to the fiscal year ended March 2016, Capcom had a basic policy of maintaining stable dividends, and in the fiscal years ended March 2009 and 2011, the annual dividend was raised 5 yen in conjunction with improved business results. Since the fiscal year ended March 2017, the basic policy has been to maintain a consolidated payout ratio of 30% and to strive for stable dividends. As a result, the annual dividend per share in the fiscal year ended March 2018 was 60 yen, the highest ever in the 28 years of continuous dividends since our listing.
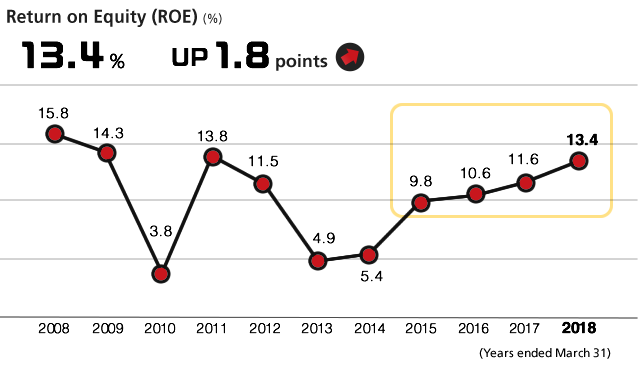
Although net assets increased between the fiscal years ended March 2007 and March 2009, stable net income resulted in ROE of around 14%. In the fiscal years ended in March 2010, 2013 and 2014, this figure declined due to decreases in net income from the recognition of special losses on restructuring and business restructuring expenses. From the fiscal year ended March 2015, ROE has once again been on the rise on the elimination of special losses and improved profitability.
PDF download
-
Capcom’s Value Creation: Past, Present, Future (PDF:3.26MB/14 pages)
 11-Year Summary of Consolidated Financial Indicators(PDF:408KB/2 pages)

