
Introduction
Continuing to create financial and non-financial value
Achieving eight consecutive years of increased operating income
The game industry is continuously changing, in step with the evolution of AI, communications, andother advanced technologies. At Capcom, we see these changes as an opportunity, and as a result of our efforts to strengthen our development structure and promote digitalization, the fiscal year ended March 2021 marks eight consecutive years of increased operating income. Though we split our stock on April 1, 2018 and again on April 1, 2021 to improve its fluidity and expand our investor base, as our performance improves, our stock price also continues to rise steadily. We will continue to increase our corporate value (market capitalization) with sustainable business growth so that we can reward our stockholders’ loyalty.

Providing smiles and moving hearts all across the globe
Since Capcom’s founding in 1983, we have continued to move hearts and deliver smiles through the entertainment of games. In recent years, the spread of the internet, PCs, and smartphones has made it possible to enjoy games even without game consoles, while at home, and in any country or region around the world. Further, our game software sales volume has been increasing, driven primarily by digital sales. We will continue to strive in our business activities in an effort to contribute to the improvement of quality of life for people throughout the world by provding high quality entertainment.

Management Message
Corporate Philosophy

Our purpose is to be a creator of entertainment culture. Through development of highly creative software contents that excite people, stimulate their senses, and bring smiles to their faces we aim to offer an entirely new level of game entertainment. Since Capcom’s establishment in 1983, we have leveraged our strength in world-class development capabilities to create a plethora of products. Game content is an artistic product that fascinates people, consisting of highly creative, multi-faceted elements such as characters, stories, worlds and music. This content can be deployed in a variety of media while being used to support the creation of a richer society. Going forward, Capcom aims to become a company that brings happiness to people and society by offering the most entertaining content in the world.


Rooted in our unwavering philosophy, we are generating sustainable corporate value with our world-class development capabilities and management foundation.
Kenzo Tsujimoto
Chairman and Chief Executive Officer (CEO)

Accelerating our digital strategy for our long-term goal of becoming a digital content company whose scope goes beyond games.
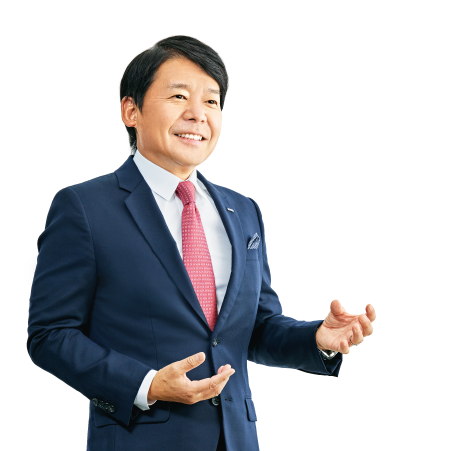
Haruhiro Tsujimoto
President and Chief Operating Officer (COO)


Aggressive investment for growth backed by a strengthened financial foundation in response to an evolving market.
Kenkichi Nomura
Director, Executive Corporate Officer
and Chief Financial Officer (CFO)

Generating and cultivating popular IPs Promoting an enhanced digital strategy
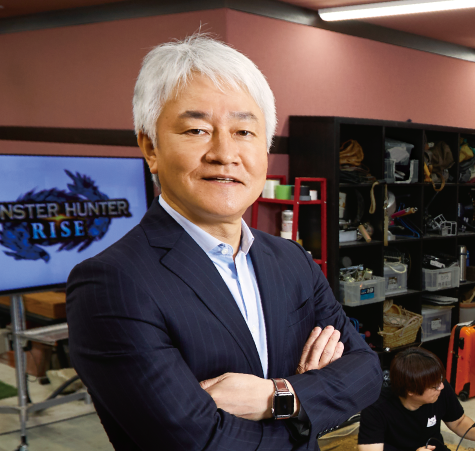
Yoichi Egawa
Director and Executive Corporate Officer
in charge of Development Divisions and Pachinko & Pachislo Business Divisions of the Company
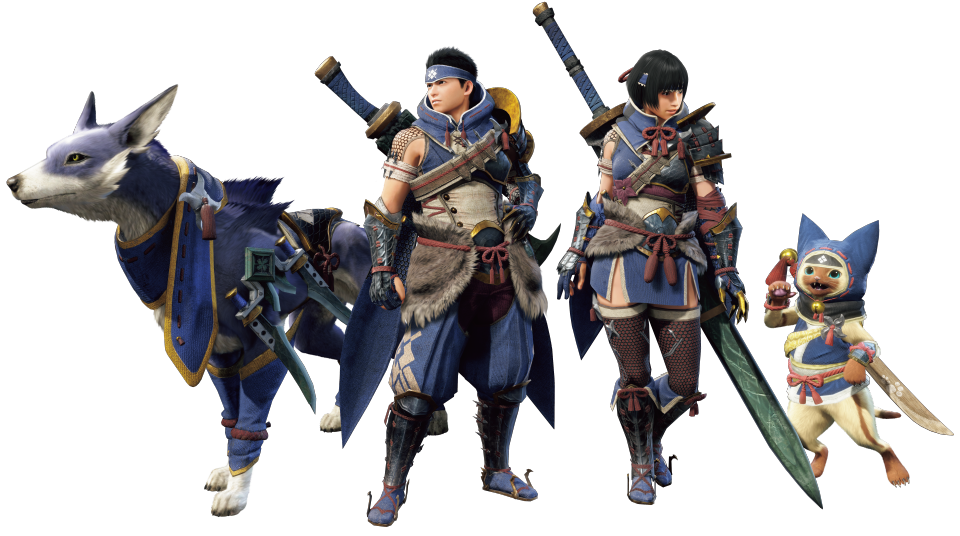
Whether solo or with friends, it’s easy to pick up and play, and will leave you wanting more. Get ready to rise to a new hunting ground.

Message from an External Director
Pursuing governance that takes sustainable growth into account, including ensuring effectiveness of the Board of Directors and the diversity of key human resources.
Yoshihiko Iwasaki
External Director (Independent Director)
<Full-time member of the Audit and Supervisory Committee>

Message from an External Director
Capcom will quickly ascertain management risks and make ongoing improvements to a governance structure that features a balance of offensive and defensive approaches.
Makoto Matsuo
External Director (Independent Director)
<Member of the Audit and Supervisory Committee>
CAPCOM INTEGRATED REPORT 2021
PDF (Complete version) (PDF:12.5MB/ 103 page)
PDF (by section)
Value Creation Story
(PDF: 6.2MB / 24 page)
- Create Financial and Non-Financial Value
- Corporate Philosophy
- History of Value Creation
- Major Intellectual Properties (IP)
- Effectively Leveraging IP
- World Leading Development Capabilities / Digital Strategy Performance
- ESG Highlights
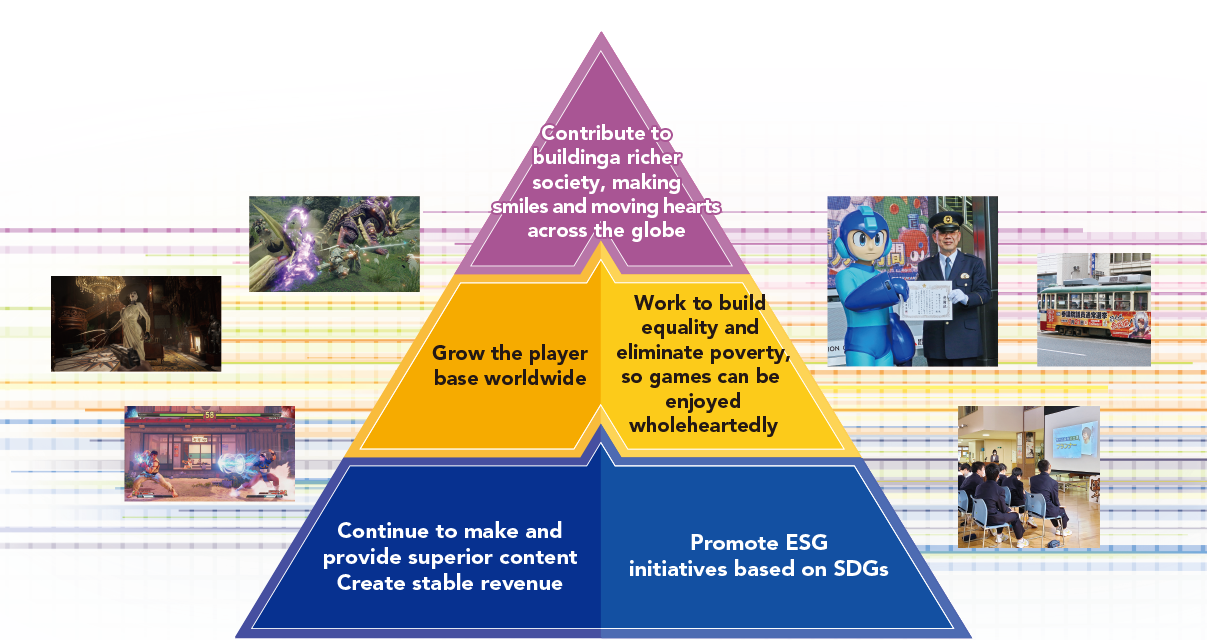
- Value Creation Model
- Financial Highlights
- Business Segments Highlights
- Medium- to Long-Term Vision


