Stock Quote
Income Statements (Japan GAAP)
Close
-
(Millions of yen)
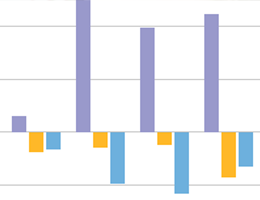
2024/3 1Q 2024/3 2Q 2024/3 3Q 2024/3 Net sales 43,858 74,934 106,179 152,410 Cost of sales 13,587 29,078 40,128 67,755 Gross profit 30,271 45,855 66,051 84,654 Margin (%) 69.0 61.2 62.2 55.5 Selling, general and
administrative expenses6,224 12,019 18,346 27,572 Operating income 24,047 33,835 47,704 57,081 Margin (%) 54.8 45.2 44.9 37.5 Non-operating income 1,870 2,430 1,889 3,606 Non-operating expenses 52 100 133 1,265 Ordinary Income 25,865 36,164 49,460 59,422 Margin (%) 59.0 48.3 46.6 39.0 Special gains 1 1 435 410 Special losses 0 0 298 549 Net income (loss) before income taxes 25,866 36,165 49,598 59,282 Margin (%) 59.0 48.3 46.7 38.9 Income taxes-current 4,089 6,865 9,884 13,851 Income taxes-deferred 3,613 4,012 5,077 2,056 Net income (loss)
attributable to owners of the parent18,163 25,287 34,636 43,374 Margin (%) 41.4 33.7 32.6 28.5 -
(Millions of yen)
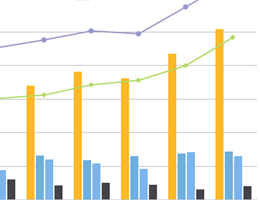
2020/3 2021/3 2022/3 2023/3 2024/3 Net sales 81,591 95,308 110,054 125,930 152,410 Cost of sales 40,643 42,567 48,736 52,110 67,755 Gross profit 40,947 52,741 61,317 73,819 84,654 Margin (%) 50.2 55.3 55.7 58.6 55.5 Selling, general and
administrative expenses18,119 18,145 18,408 23,006 27,572 Operating income 22,827 34,596 42,909 50,812 57,081 Margin (%) 28.0 36.3 39.0 40.3 37.5 Non-operating income 480 1,035 1,859 864 3,606 Non-operating expenses 350 786 439 307 1,265 Ordinary Income 22,957 34,845 44,330 51,369 59,422 Margin (%) 28.1 36.6 40.3 40.8 39.0 Special losses 67 16 8 225 549 Net income (loss) before income taxes 22,890 34,828 44,322 51,143 59,282 Margin (%) 28.1 36.5 40.3 40.6 38.9 Income taxes-current 8,472 10,084 10,987 16,895 13,851 Income taxes-deferred (1,531) (179) 780 (2,488) 2,056 Net income (loss)
attributable to owners of the parent15,949 24,923 32,553 36,737 43,374 Margin (%) 19.5 26.1 29.6 29.2 28.5
Related Article
 Online Integrated Report
-
IR Materials Download
-
IR Social Accounts
-
Top 5 Recommended Pages
(as end of Jan, 2024)


